
21 Tactics To Find & Fix The Leaks That Cost You Sales

Ecommerce conversion rate optimization (CRO) is the process of finding where and why visitors drop off in your online store and finding fixes that increase the odds they complete the purchase.
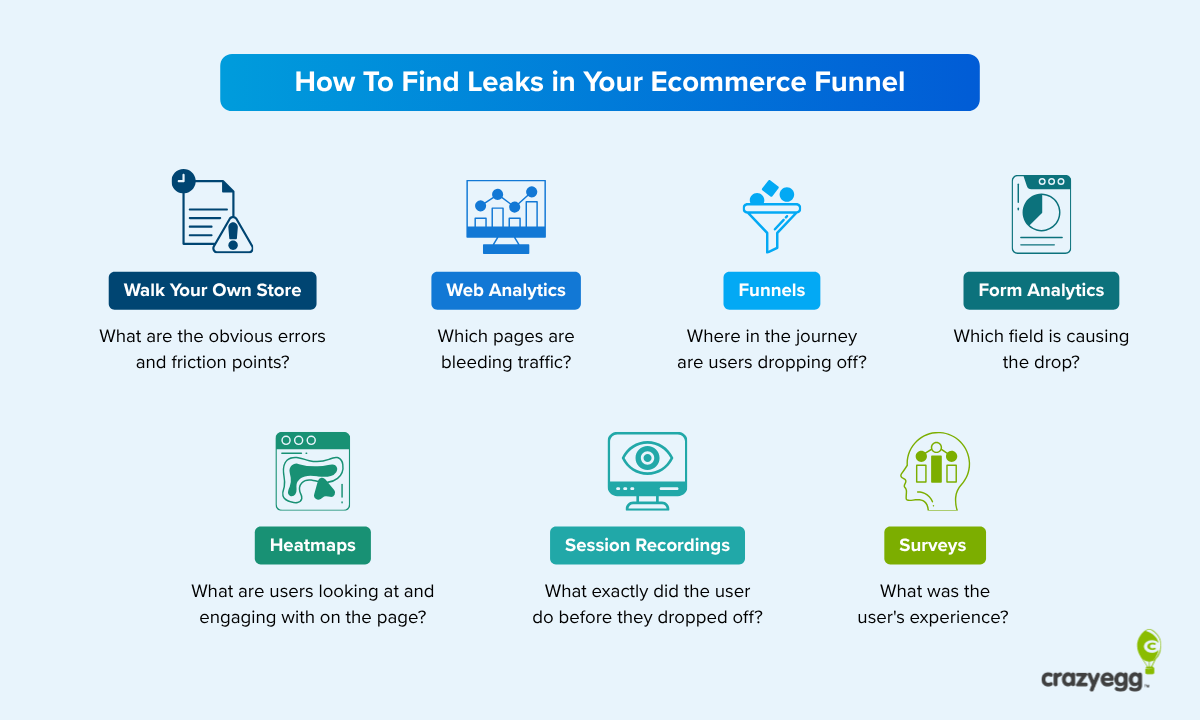
To find and diagnose leaks, ecommerce CRO specialists use survey and analytics tools, such as web analytics, funnels, form analytics, heatmaps, and session recordings.
Potential fixes to low conversion rates include improving product search and product catalog structure, providing in-depth product descriptions and detailed visuals, and simplifying the ecommerce checkout process.
The article shares 7 ways to identify leaks in your funnel and 14 ecommerce CRO strategies to plug them.
How To Find Leaks in Your Ecommerce Funnel
When looking for leaks on your ecommerce site, start with web and funnel analytics to find pages with the highest bounce and exit rates. Next, use form analytics, heatmaps, session recordings, and surveys to understand why customers drop off.
#1 Walk your own store
Before you deploy analytics, surveys, and experiments, walk your own store, as if you were a customer. From the moment they land on your site, through checkout, through the confirmation page and emails.
As you go, note down glitches and friction points, like search not returning relevant results or broken payment links.
It’s not a scientific method, but it helps you identify the most obvious issues affecting your conversion rates.
#2 Find pages that bleed traffic with web analytics
Start by isolating pages that lose the most traffic with web analytics.
Look for two metrics: bounce rate and exit rate.
Bounce rate refers to visitors who drop off immediately after landing on their first page. It’s a read on the first impression the landing page makes. For example, how quickly it loads, how much trust it inspires, or whether it offers what the person was looking for.
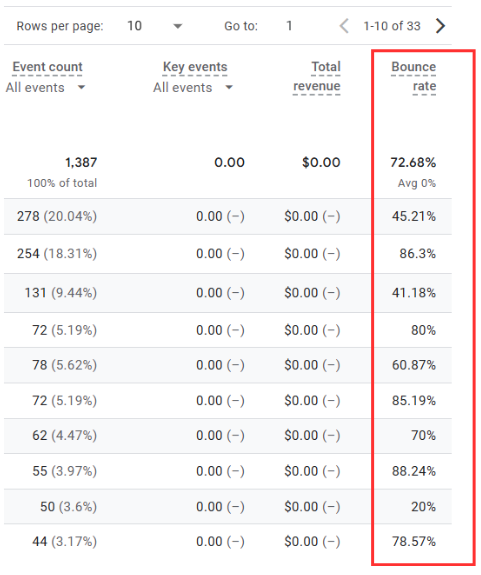
Exit rate tells you how likely visitors are to leave from a specific page, for example, a checkout page, after exploring other pages. It signals friction in the conversion flow, inadequate product descriptions, technical issues, and other factors that put the buyer off from making a purchase.
#3 Find where users drop off with funnels
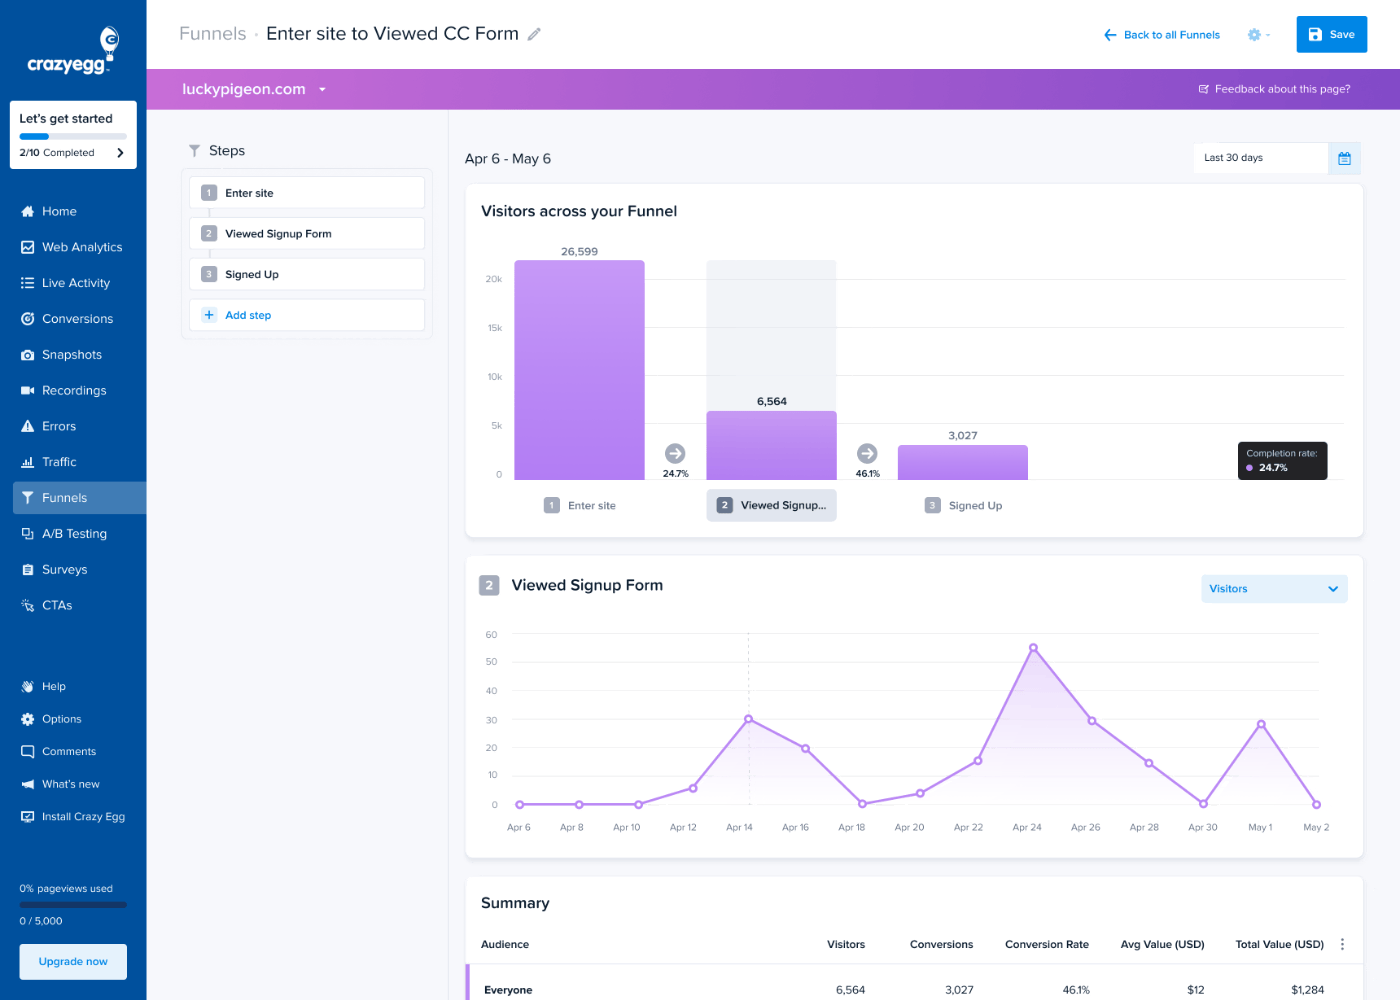
Ecommerce conversion funnel reports show you where exactly in the journey your customers drop off.
Say your conversion funnel consists of 4 steps: Visit category page, Visit product page, Add to cart, Check out. If you see a big drop between Add to Cart and Check out, focus on the checkout stage to understand why customers abandon their cart.
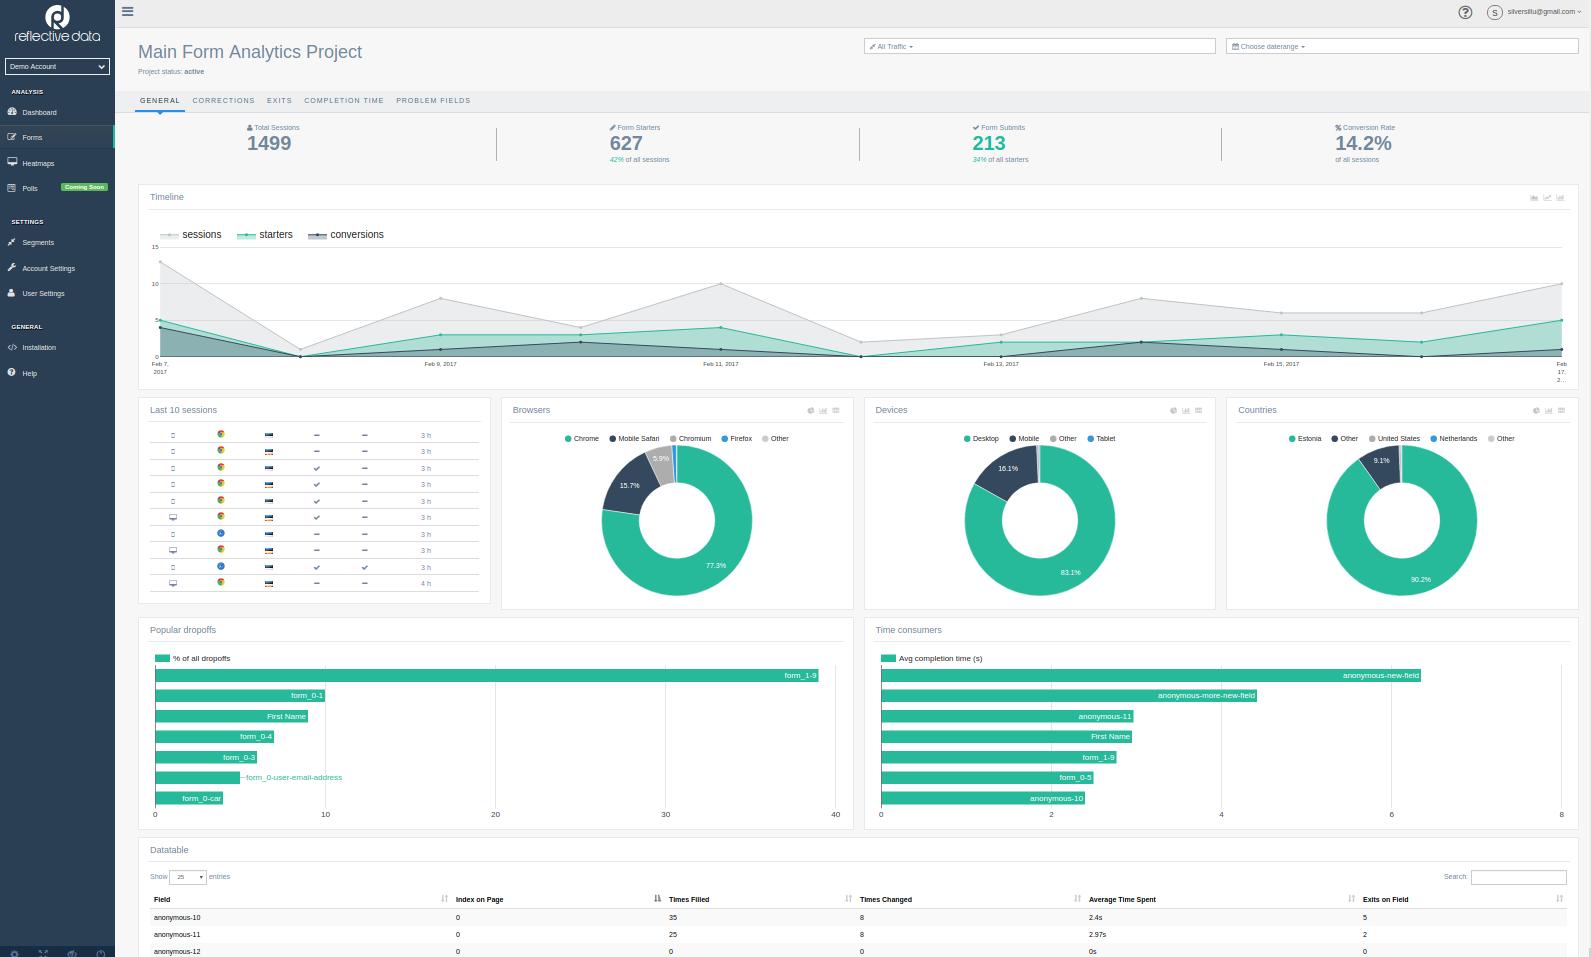
#4 Find checkout fields that cause friction with form analytics
Form analytics show which form fields cause friction and drop-offs on your checkout page.
Form analytics answers questions like:
- How long do people spend in each field?
- Which fields get refilled after a validation error?
- Which field does abandonment happen on?
- How many errors does each field throw per session?
#5 Identify engagement patterns with heatmaps
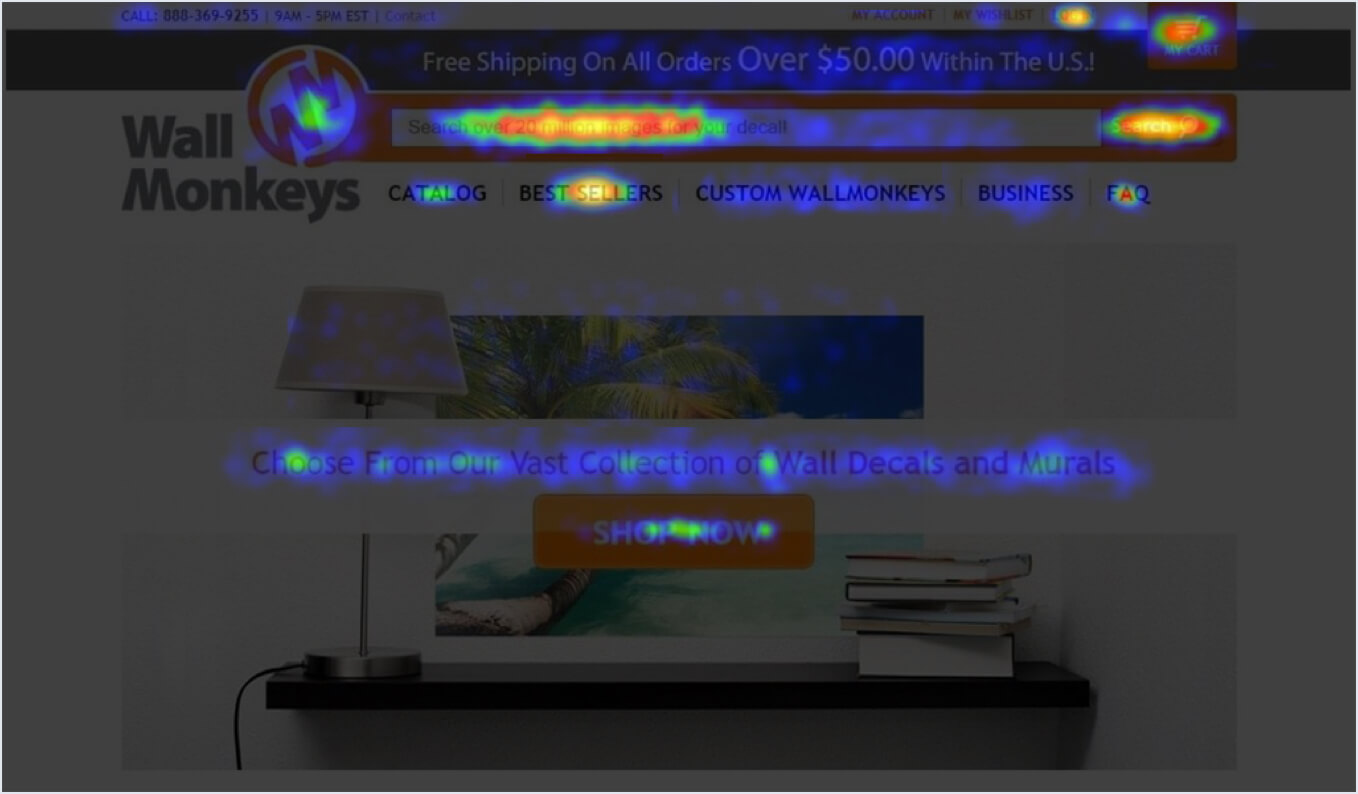
Heatmaps show you visitor click and scroll patterns on a page. They help you understand which sections of the page attract most attention, which get ignored, and which cause friction.
For example, WallMonkeys, one of Crazy Egg’s customers, used heatmaps to redesign their homepage layout, which led to a 550% increase in conversions. The fix was replacing the floating CTA button with a search bar because that’s what visitors engaged with most.
#6 Learn why visitors behave that way with session recordings
Session recordings show you what exactly a specific user does on your ecommerce website. For example, how they scroll up and down the product page, where they click, and where they hover.
This gives you a more granular understanding of user behavior than heatmaps and helps you surface friction points that make visitors drop off.
For instance, Happy Trails used them to discover that some products showed as out of stock even though they were available and ready to ship, so shoppers didn’t even put them in their carts.
#7 Ask visitors for feedback with surveys
Asking shoppers for feedback about their experience via surveys gives insights you don’t get from behavior analytics.
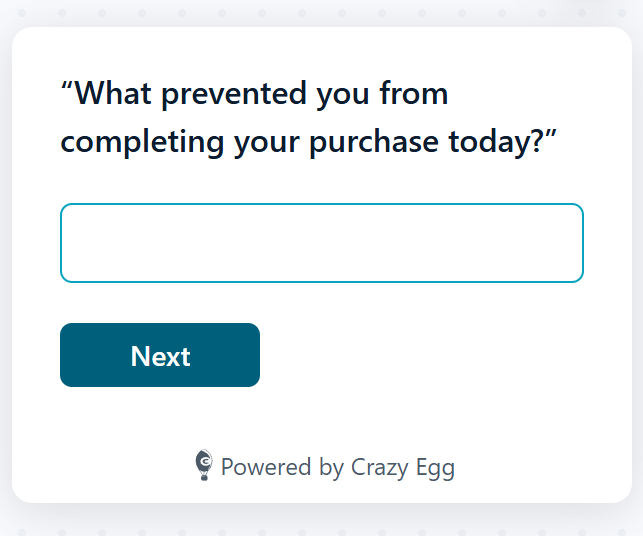
For example, you could run exit surveys that appear when the visitor is about to leave the product or checkout page to ask what’s preventing them from completing the purchase.
14 Conversion Rate Optimization Strategies To Fix The Leaks In Your Ecommerce Funnel
Now that you know how to find leaks, let’s look at 14 ways to improve your conversion rates.
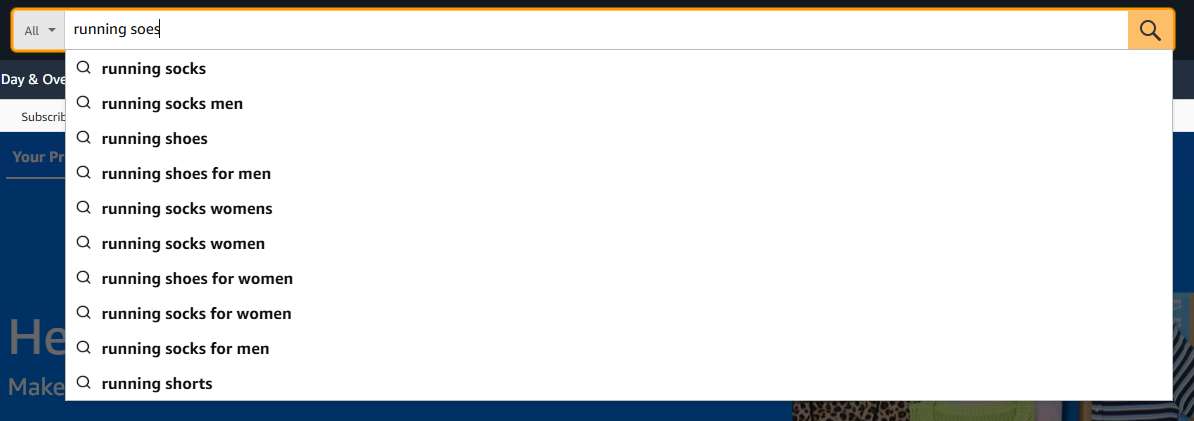
#1 Fix on-site search: catch typos, synonyms, and zero-results
Search users are among the most valuable website visitors. Constructor’s 2024 study found searchers were 24% of visitors but drove 44% of revenue, and converted at 2.5 times the rate of non-searchers. So make sure the search engine is reliable and makes it easy to find relevant products.
AI-powered tools like Doofinder, Argolia, or Klevu solve common search challenges, like spelling mistakes/variations, synonyms, or partial matches. They provide autocomplete and personalized search results based on past behavior.
#2 Filter and sort the way shoppers think
Rewrite your categories, filters, and sorting around the shopper and how they describe what they want.
How do you find out?
Interview your customers about how they’d search for a specific product. Record the vocabulary they use verbatim and use it as category names and filters.
#3 Display high-quality product images
Invest in high-resolution visuals that show the product accurately and in detail.
Your product photos should:
- Show the product from multiple angles
- Include a lifestyle shot showing scale and context
- Enable zoom
- Be easy to view on mobile
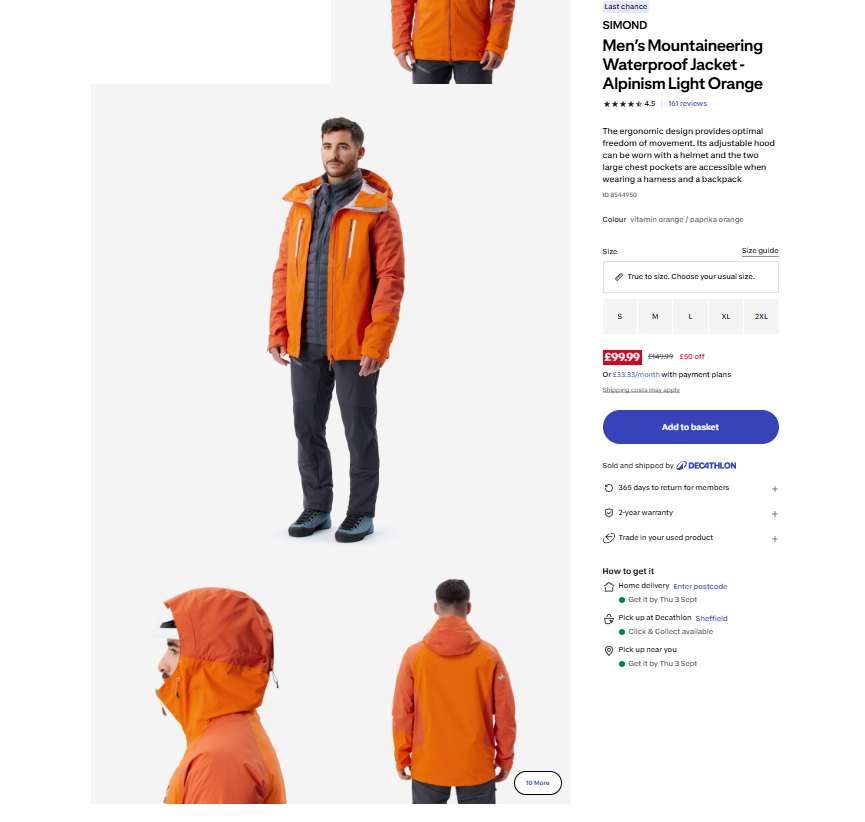
In Salsify’s 2026 consumer research, 61% of shoppers said product images and videos are the most important product page element when completing a purchase, outranking descriptions, reviews, and pricing.
#4 Write detailed product descriptions
Make your product pages detailed so shoppers can make an informed decision.
Product page content depends on the product. For clothing, for example, the bare minimum is:
- A benefit-driven product description
- Price
- Sizing/fit guide
- Fabric details and care
- Delivery and returns policy
- Brand information
- Customers’ questions and answers
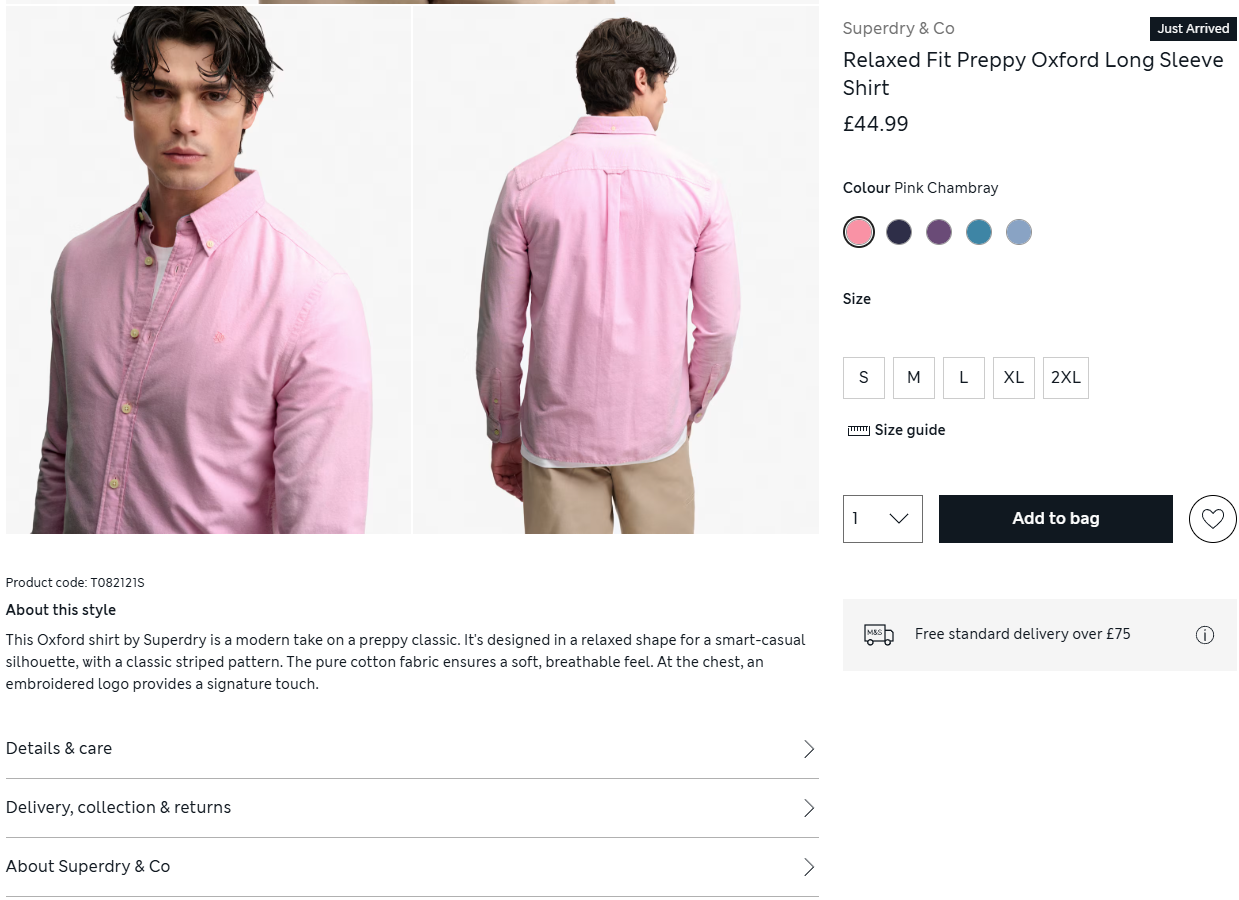
Unlike in a regular store, ecommerce customers cannot inspect the product themselves or ask the store assistant for information. They rely entirely on the product description, and if they can’t find the details they need, they won’t risk it and go elsewhere.
A side note: Accurate product descriptions also reduce returns. “Product not as described” accounted for 32% of all UK and EMEA returns in Signifyd’s 2025 study.
#5 Show shipping and tax before the cart
Unexpected shipping and tax charges account for 40% of cart abandonments (Baymard 2025). To avoid it, show the full price, including tax and shipping, on the category and product pages.
If the tax or shipping rates depend on the shopper’s location, show an estimate or use IP geolocation to find the visitor’s location.
#6 Show reviews, guarantees, and security cues to build trust
If your ecommerce site doesn’t inspire trust, a customer won’t risk losing their money.
According to Baymard’s checkout research, 19% of US shoppers abandoned a cart because they didn’t trust the site with their card details, and Forter’s 2024 Trust Premium Report found shoppers spend 51% more with retailers they trust.
What do users consider when making purchases?
- Reviews and ratings (include review count and customer-generated images to strengthen social proof)
- A visible return and refund policy
- SSL icon and payment logos on the payment page
- A money-back or satisfaction guarantee
- Third-party badges
- Contact information (phone, address, live chat)
#7 Default to guest checkout and enable SSO
Default guest checkout removes one of the major friction points from the conversion funnel: Baymard’s cart abandonment research (September 2025) showed that 18% of shoppers didn’t complete a purchase because they had to create an account.
Instead of forcing shoppers to create an account before they can buy, offer it as an option after the purchase, just like Etsy.
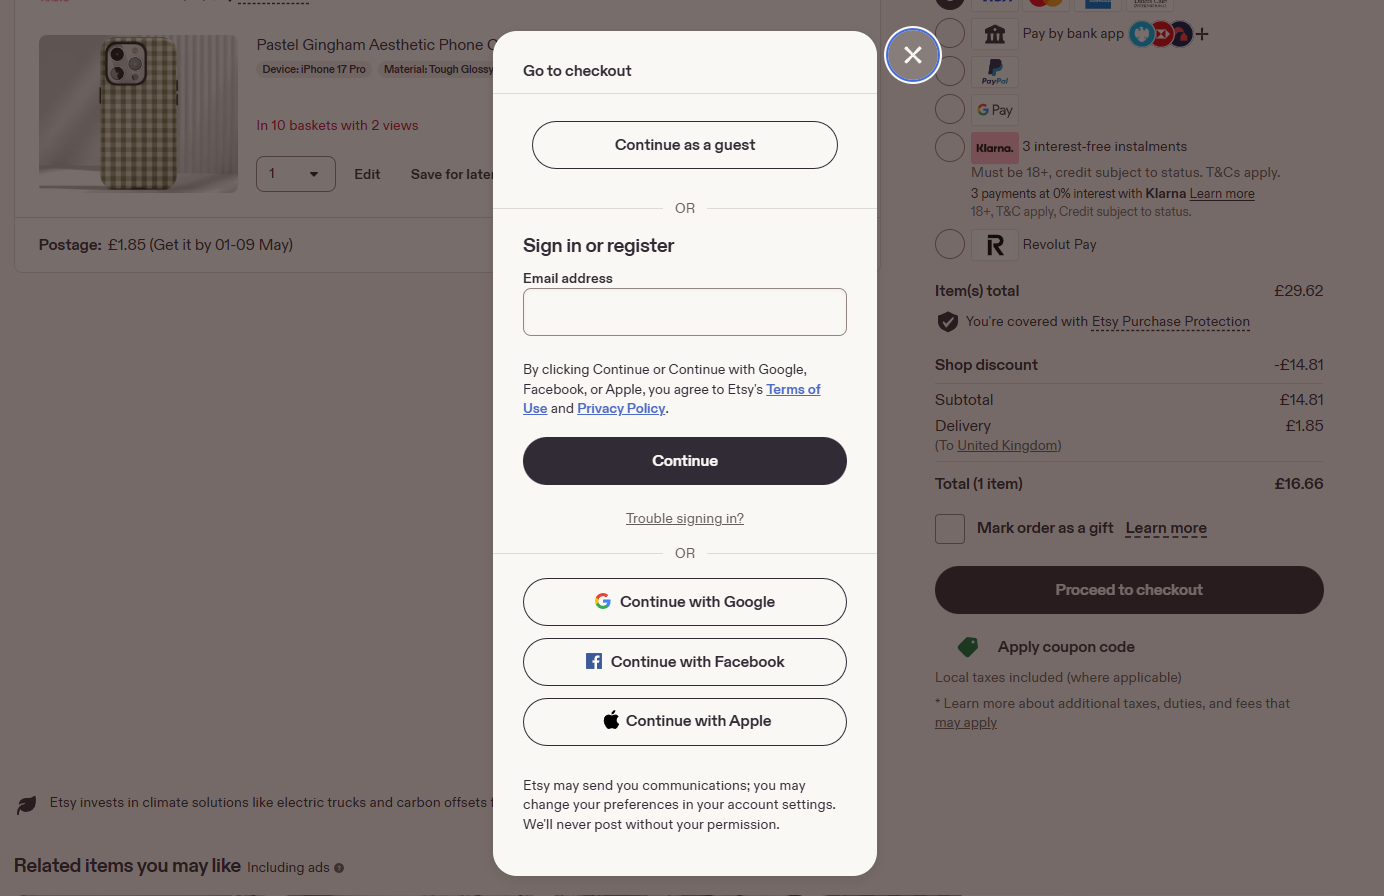
Etsy also adds single sign-on (Google, Apple, Facebook), so shoppers can log in using their existing credentials. It shortens registration and lifts conversion by an estimated 20-50%.
#8 Make your forms easy to complete
17% of shoppers abandoned a purchase in 2025 because the checkout was too long or complicated.
Cutting the field count, for example, by combining the first and last name, is the obvious place to start. Baymard’s 2025 usability testing puts the ideal field count at 7-8.
However, according to their 2024 testing, the required effort matters more than the pure step count.
So, make your forms easier to complete by:
- Choosing the right field type (text, radio, drop-down menu, etc).
- Enabling browser autofill on every field. Chrome’s 2024 study found autofill users abandoned forms at least 75% less often than users who typed everything.
- Adding inline validation that flags errors as the user types. Atticus Li’s 2026 analysis of 500 form A/B tests found this cuts form errors by 22% and lifts completion by 9%.
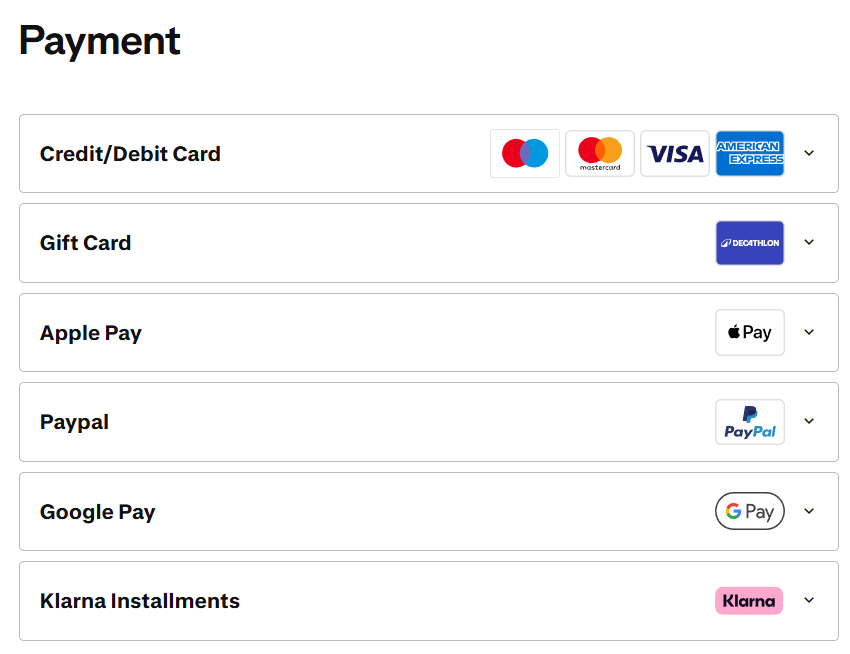
- Offering payment wallets (Apple Pay, Google Pay, PayPal) so shoppers can skip the form entirely.
- Hiding coupon fields behind a small “Have a promo code?” or filling them automatically.
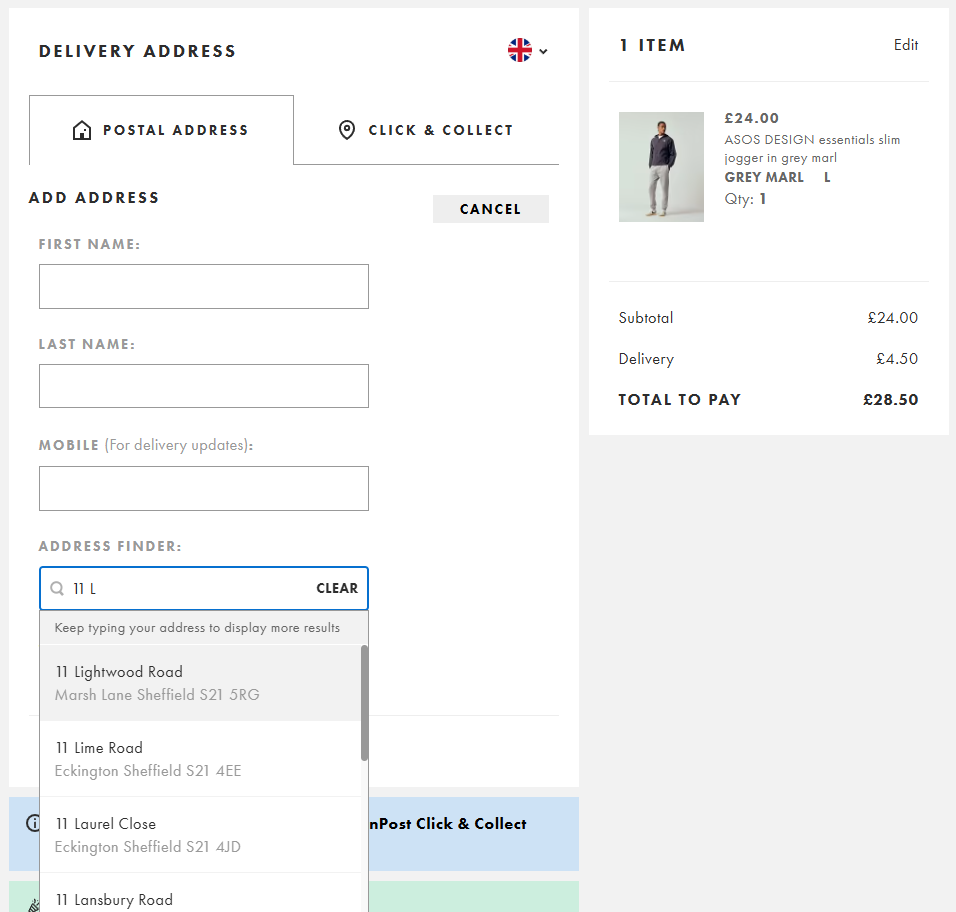
- Adding an automatic address finder and defaulting the billing address to the shipping address.
#9 Show a progress indicator and order details on multi-step checkouts
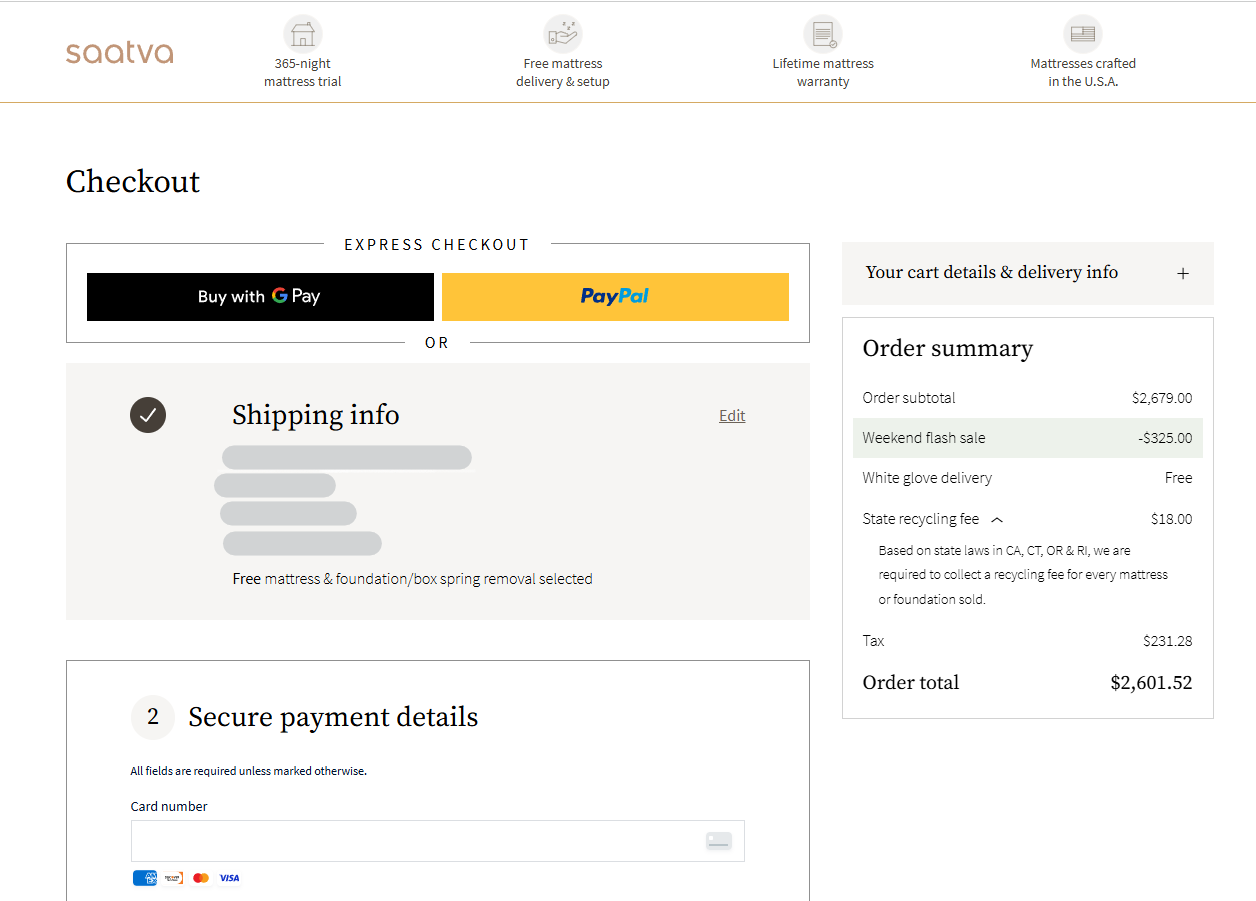
If you choose a multi-page checkout flow, add a progress indicator and display all order details on all screens.
Progress indicators and order summaries on all pages make multi-step processes more user-friendly. They show users what they’re buying and how much it costs, where in the process they are, and what else they have to do to complete the purchase.
#10 Offer the payment options your audience uses
Enabling recognized payment methods, like Apple or Google Pay, increases conversion rates by speeding up the checkout process, reducing errors, and increasing customer trust.
Stripe estimates that only 40% of global ecommerce transactions rely on card payments, and their 2025 holdback experiment found adding one extra relevant method raised conversions by 7.4%.
Localized wallets performed the best. Enabling iDEAL increased conversions in the Netherlands by 39%, Alipay in China by +91%, and BLIK in Poland by +46%.
Side note: Adding Buy Now Pay Later (BNPL), like Klarna or Afterpay, also reduces the immediate financial impact of the purchase, which increases the AOV. Stripe’s experiment measured a revenue lift of up to 14%.
#11 Recover abandoned carts with exit popups, email, SMS, and push notifications
Cart recovery exit popups, email, SMS, and push notifications bring back customers who got interrupted while making the purchase.
Klaviyo’s 2024 benchmark, based on more than 143,000 abandoned cart flows, found recovery email flows deliver the average RPR of $3.65 and the average conversion rate of 3.33%.
That’s email only. Adding push and SMS will increase the impact.
Add cart-abandonment exit popups as a second layer to catch shoppers before they leave the tab. OptiMonk’s 2025 data puts cart-abandonment exit popup conversion rates at 17.12%.
#12 Use AI to personalize the shopping experience
AI tools let ecommerce brands personalize the shopping experience for individual users, which, according to Bloomreach 2026 data, increases conversion rates by 15-30%.
Practical places to start are:
- Product recommendations (“Frequently bought together”, “Recommended for you”)
- Dynamic homepage content based on first-time vs returning, traffic source, or location, etc.
- Personalized search results. Nosto’s 2023 platform data found that 70% of consumers are more likely to complete a purchase when search results are personalized to their purchase history.
- Behavioral email, SMS, and on-page messages triggered by specific actions (browse abandonment, wishlist adds, category views).
- Segmented promotions (For example, a first-order discount for first-time shoppers and a loyalty offer for returning ones).
#13 Get pages loading in under three seconds
If your pages load too slowly, visitors bounce.
How slow is too slow?
Research on the impact of loading times on website conversion rates is rather dated, so I won’t give you any specific figures. Google’s Core Web Vitals guidance recommends a Largest Contentful Paint under 2.5 seconds for a good user experience.
Improve your page loading times by:
- Compressing and resizing images to the actual render size
- Using WebP and AVIF images instead of JPEG/PNG
- Lazy-loading below-the-fold images
- Removing unused JS scripts and CSS and deferring or loading non-critical ones asynchronously
- Auditing third-party scripts like analytics tools (Crazy Egg doesn’t slow down your website)
- Lazy-loading chat widgets
#14 Optimize your ecommerce site for mobile
Ecommerce sites get more traffic from mobile than desktop, yet mobile conversions consistently lag behind desktop ones. Dynamic Yield’s July 2026 benchmark data puts 74% of ecommerce traffic on phones and mobile cart abandonment at 79.98%, roughly 9 percentage points above desktop.
Optimizing your ecommerce store for mobile helps you bridge the gap.
Common mobile optimizations include:
- Responsive design that adapts layout, image sizes, and typography to smaller screens
- Tap targets at least 44 pixels tall, so it’s easy to hit with a thumb
- A sticky “Continue” or “Pay” button in the bottom viewport so the CTA stays visible above the browser toolbar
- Apple Pay and Google Pay for one-tap checkout that skips form-filling
- Tap-friendly interactions instead of hover-only ones (zoom, tooltips)
Turn Your Ecommerce Conversion Rate Optimization Efforts Into A Continuous Loop
“Ecommerce conversion optimization isn’t a one-off exercise.”
It’s a terrible cliché, but it’s true. Finding all leaks and implementing fixes at once never happens in real life.
Instead, you find the page or checkout stage that’s leaking the most with web analytics and conversion funnels, analyze it with behavior analytics and survey data, build solutions, test them, and analyze the results. Then use the insights to inform the next round of optimizations.
Crazy Egg offers all the tools you need to implement the full CRO loop, from web analytics through heatmaps, session recordings, and surveys, through A/B testing. If you’d like to see how it can help you improve your ecommerce conversion rates, get in touch with our Sales team.
Frequently Asked Questions
How do I calculate my ecommerce conversion rate?
Conversion rate is the percentage of customers who complete the desired action, usually a purchase. To calculate your conversion rate, divide conversions by visitors and multiply by 100. If your store had 150 orders from 5,000 visitors last month, your conversion rate was 3%.
(150 ÷ 5,000) × 100 = 3%.
Ecommerce sites usually calculate by sessions rather than unique visitors, because the same shopper can buy more than once in a period.
What’s the difference between micro and macro conversions?
Macro conversion is the ultimate objective, for example, a sale. Micro conversions are the steps leading to the macro conversion. For example, add-to-cart, wishlist adds, and email signups are all micro conversions.
What is a good ecommerce conversion rate?
A good ecommerce conversion rate is around 2.5-3%, but rates vary by industry, device (mobile vs desktop), traffic source (organic vs direct), and average order value (AOV). For example, in July 2026 (Dynamic Yield), the average conversion rate for Luxury and Jewelry stores was 0.58%, while Veterinary and Pet care stores recorded 7.68%.
What’s a good conversion rate on Amazon?
A conversion rate of 13-15% is considered excellent on Amazon, with averages in the 8-12% range. These benchmarks are based on seller-reported figures and vary across industries, so treat them as ballpark figures. Generally, Amazon retailers have higher conversion rates thanks to higher customer trust and buyer intent.

